Reviewing the test reports
After all this dancing, we'd like to review our moves of course! All tests that completely run are wrapped into a single HTML file, including step results, running time, screenshots and many more.
## Open the report
By default, reports are saved in the reports directory, next to where you start JOSF. Navigate to the JOSF folder on your machine and open the reports directory. Here, you can see all the reports that were generated during these tutorials. The name of a report, by default, is setup like date-time - name of test.html. This goes for test cases and test suites both.
Go ahead and open the test report. We're opening the "Calculate some Numbers!" report.
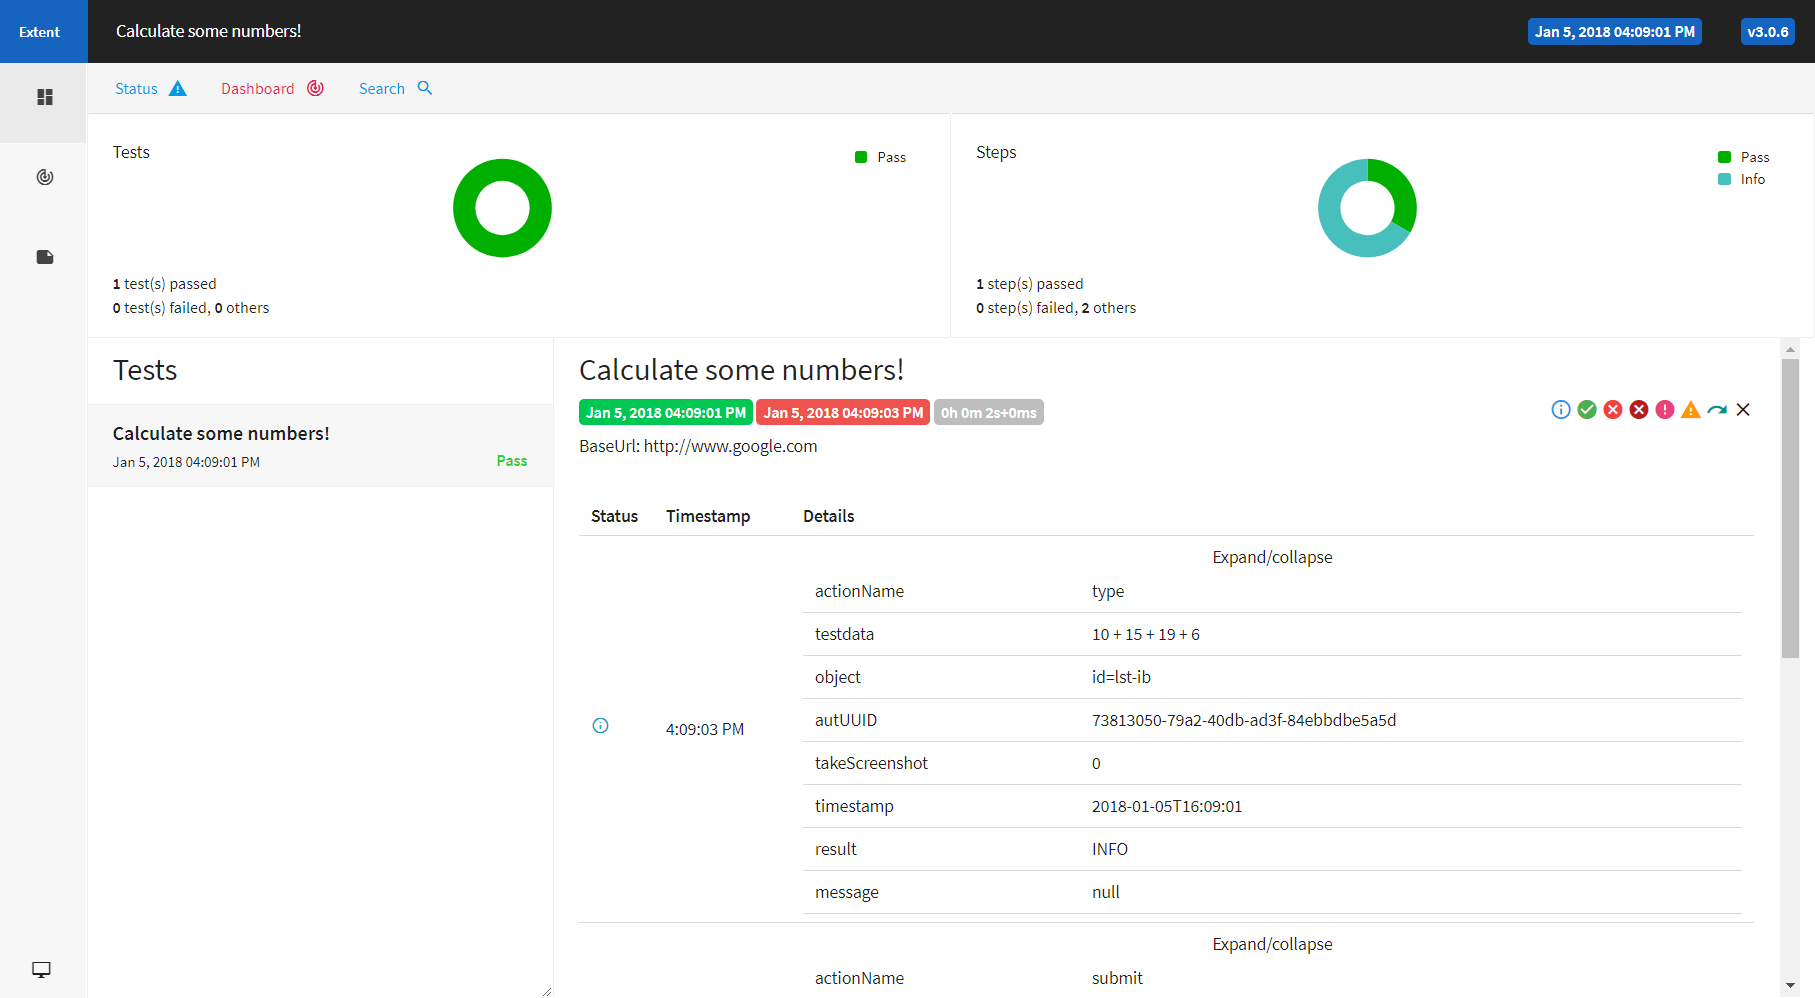
In this view, we can identify a couple of reporting elements. At the top, we see two pie charts. The left one shows all the test results and the right one shows all step result. We're only viewing a test report of a single test case, so it's not that exciting at this point.
Second, the Test column on the left. Again, this only reports the result of a single test case. When running a test suite, more test cases will be listed here. The test case we've run is shown as "Calculate some numbers!". It shows us that it was run on Jan 5, 2018 at 4:09 PM and that the overall result of the test is pass.
Third, the test step overview. Again, it shows the title, but also how long the test actually run. Two seconds in this case. After that, a table is shown per test step. The actionName, testdata and object are the most important, as that is the actual data used when that step was executed. It also holds the result and an optional message (which is null is there is nothing special to report).
Review a failed test
Let's generate a new report, but make it fail on purpose. Go back to the JOSF web-interface and open the test case "Calculate with numbers!". Edit this test case, so that the action verifyText will validate the test data from 50 to 51. Save and execute the test. You'll notice that the page shown after running the test will state that a step failed. Open the latest report and review it.
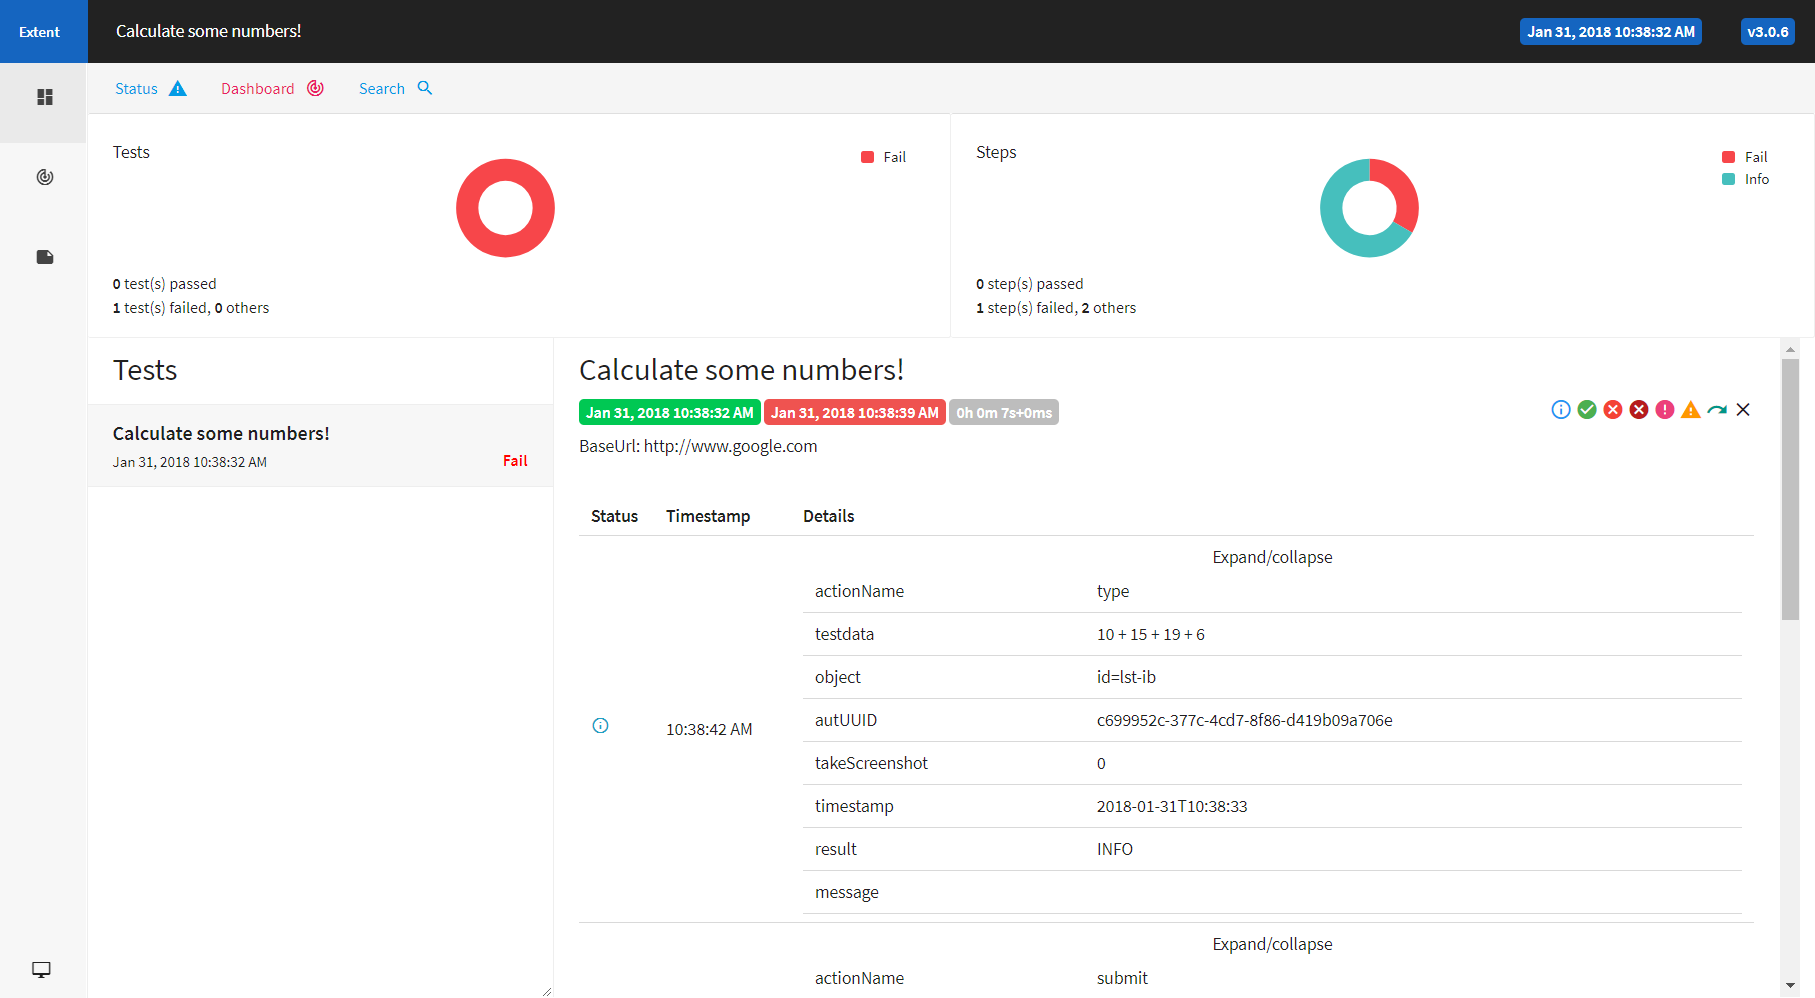
This report is a lot more interesting! The pie charts tell us that the test failed, and that 1 out of three steps were the cause of that. Scroll down to the failed test step and check out the message: expected:<5[1]> but was:<5[0]>. JOSF has reported that it expected the number 51, but ran into 50! Also, whenever a test step fails, a screenshot is taken to review it yourself. You can open this by right-clicking and opening it on a different tab, to view it in full-size. Here, a clear view is shown of what state the website was in.
Note: A screenshot is taken AFTER the test step was run.
Now that we've reviewed a test report, change it back to the correct number and try to run the test suite. You'll see that it will list all included tests.
After this, let's look at some configuration, shall we?